


An Alive Clinical Biofeedback Demo — a brief step-by-step guide to Understanding and Optimizing Mind-Body Control.
Integrating mindfulness with the Alive Clinical Biofeedback program
This Alive Clinical Biofeedback demo gives you 2 options for quickly gaining insight on how to use the program.
First, a brief video explains the value in the program. Second, you can review a quick set of screenshots with explanations of specific actions within the client sessions.
You can watch this video for an explanation of the advantages and upgrade in the Clinical Alive program.
This walkthrough shows a clinician how to demonstrate the effect of mental stress on the body in real-time using Alive Clinical Version biofeedback graphing.
We can tell clients what we know, but showing them is much more powerful and motivating.
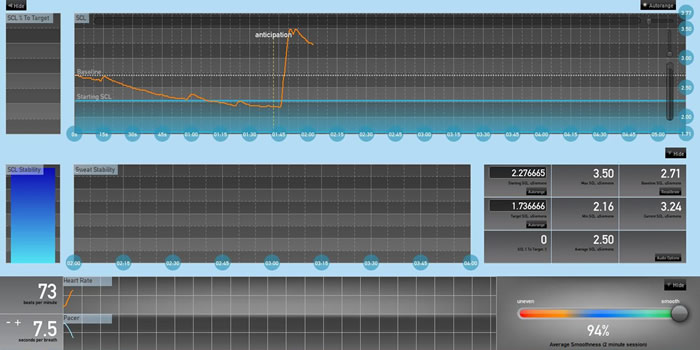
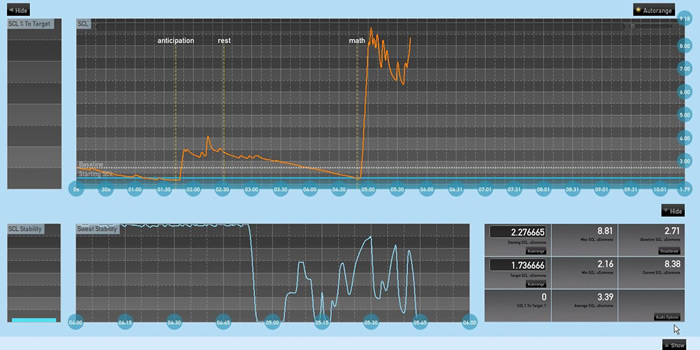
1. From the baseline level we let the SCL line stabilize, preferably letting it get a downward trend as in the example shown below example.
After going down from 2.71 microsiemens to 2.16 microsiemens, this is the perfect point at which to evoke an anticipation reaction. At timeline 1 min. 50 sec., the client was told “I will now ask you a difficult math question.”
Notice the sharp rise in the SCL line climbing to 3.50 microsiemens.
The client did not move or say anything (since the proposed question was not yet asked), so it is clear that the rise in arousal level stems from the psychological impact of anticipation.
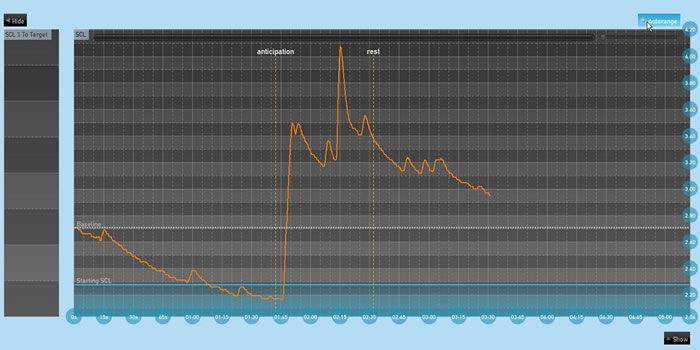
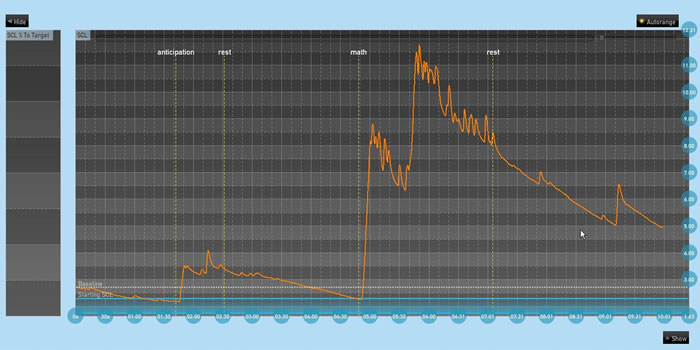
2. By pressing the Hide button we can show the client only the SCL line. After the first anticipation trigger, she is asked to rest.
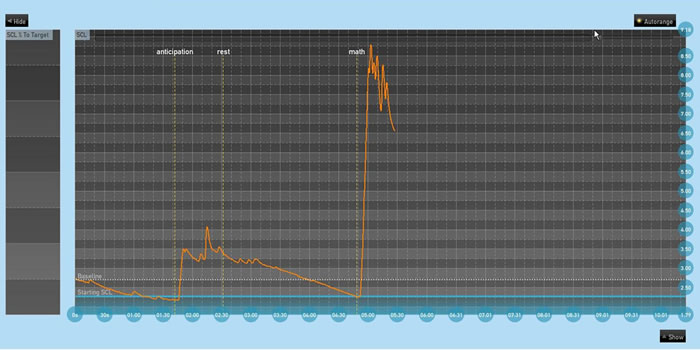
3. After approx 2 min. rest time the client is asked a question in math. Notice the very sharp rise in arousal level (to 8.5 microsiemens) showing the psychological impact on the client. Later, she commented that the thought “What if I am wrong?” passed through her mind, causing this rise in arousal level.
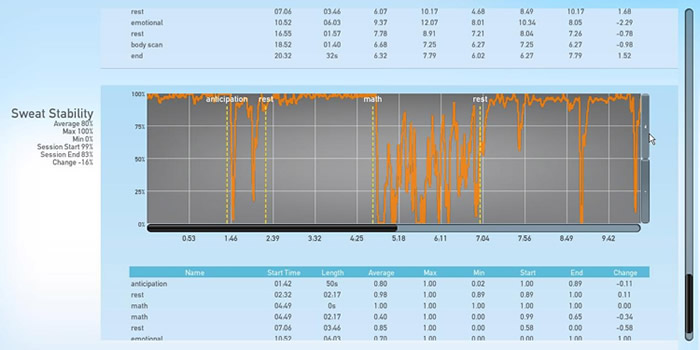
4. Showing the sweat stability graph to the client at this stage can be useful, as it indicates the sharp difference in stability when resting compared to being emotionally agitated by the math task.
5. Show the rest period, line going down. Take some time with the client to discuss this demo of how thoughts affect the body.
6. Using the clinical-view option can deepen the client’s understanding of his body’s reaction: the sharp rise in average heart rate when asked the math question, the dramatic sweat stability changes at rest compared to when challenged.
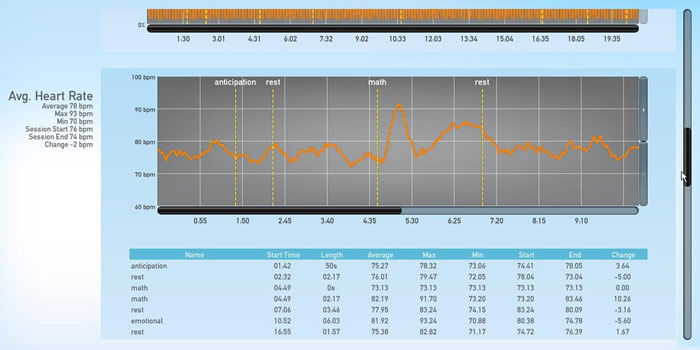
7. Another measure – the dramatic sweat stability changes at rest compared to when challenged – also shows how a client can see the reaction of sympathetic nervous system arousal in this math question exercise.